When a Simple Question Becomes a Headache
Data is everywhere, but actionable insights are rare. The RAG Graph System changes that by transforming mountains of raw data into instant, visual answers that leaders can trust. In today’s fast-moving markets, delays in understanding data don’t just frustrate they cost money, opportunities, and strategic advantage.
Across departments, simple questions often trigger long chains of emails, database queries, and manual reconciliation. By the time answers arrive, decisions are already delayed, and markets have shifted. The RAG Graph System solves this by providing AI-driven business insights instantly, breaking down silos and making complex queries easy to answer.
Typical challenges leaders face:
- A CFO wants to see Q2 expenses compared to Q1 by department.
- An HR leader needs to identify which teams have the highest attrition.
- A sales director asks which regions drove the strongest revenue growth.
Ariel Software Solutions recognized this problem and designed a transformative solution: the RAG Graph System. It allows business leaders to ask questions in plain language and receive instant, accurate, and visual insights, eliminating silos and bottlenecks.
The Invisible Bottleneck: Why Current Data Access Fails
If data is the lifeblood of a modern enterprise, most companies are hemorrhaging it. Dashboards, data warehouses, and BI tools exist, yet leaders still face the same bottlenecks:
- Data Silos That Block Clarity
Finance has its ERP. HR has its talent management system. Marketing relies on a separate CRM. Each functions well in isolation, but combining insights across systems is a painstaking process. Custom queries, middleware, and manual reconciliation become the norm, slowing decision-making and creating frustration at every level.
- Dependence on Technical Experts
BI tools are powerful but often require technical expertise. Non-technical leaders depend on analysts who understand SQL, ETL processes, and complex data models. This dependency turns simple questions into multi-day requests and makes business-critical insights a scarce, expensive resource.
- Time Lag That Costs Opportunities
In fast-moving markets, waiting days or weeks for a report is not just inconvenient it’s a strategic risk. Delayed insights mean missed opportunities, slower pivots, and lost competitive advantage.
- Overwhelming Dashboards
Even when dashboards are available, they often provide too much information and too little clarity. Metrics stack up across screens, but finding the answer to a specific question, like which product line drives revenue, is like searching for a needle in a haystack.
The result: organizations are drowning in data but starving for insight. Ariel’s RAG Graph System solves this problem by delivering actionable, visualized answers in real time.
How Retrieval-Augmented Generation (RAG) Changes the Game
Traditional chatbots are conversational, but they lack access to enterprise-specific data. They may provide generic answers, but without grounding in actual company information, the insights are unreliable.
RAG, Retrieval-Augmented Generation, enhances large language models with real-time access to company data. Here’s how it works:
- Retrieval: The system identifies and fetches relevant data from internal sources such as databases, documents, and spreadsheets.
- Generation: The LLM synthesizes the retrieved data into natural language, producing an accurate, conversational response.
The outcome: AI that not only speaks your language but knows your business. Leaders can ask precise questions and receive answers rooted in reality, not speculation.
For businesses struggling with slow insights and data silos, solutions like embedded BI and self-service reporting have proven essential. “From Raw Data to Revenue: How Izenda Embedded BI Drives BI Success” explores how real-time reporting tools can turn raw data into actionable results.
The Ariel RAG Graph System: Going Beyond Text
While traditional RAG provides text-based answers, Ariel takes it further with graph-based retrieval. By mapping relationships between data points, the system can answer complex, multi-dimensional queries that reflect real-world business thinking.
For example:
- “Compare Q2 sales to Q1, broken down by region, and highlight the top three performing markets.”
- “Show attrition trends over the past year, correlated with hiring patterns.”
- “Identify vendors responsible for the highest delays last quarter and quantify the financial impact.”
The system doesn’t just return text it produces dynamic graphs and visualizations. Executives immediately see trends, correlations, and anomalies without waiting for analysts to prepare reports.
By combining conversation with visualization, Ariel transforms how stakeholders interact with data: simple questions yield rich, actionable answers instantly.
Real-World Business Scenarios
The true impact of the RAG Graph System is best understood through its application across different business functions:
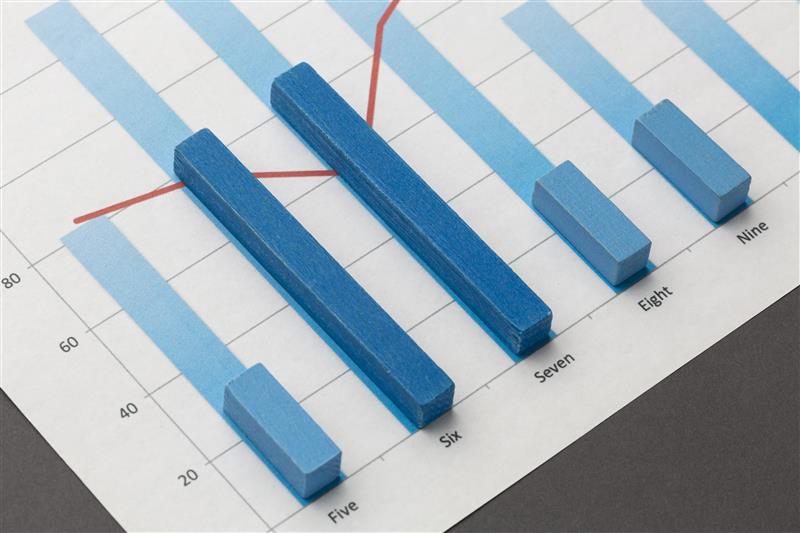
- Finance: Speed Meets Accuracy
A CFO logs in on Monday morning. Instead of emailing analysts and waiting for a week-long report, she asks, “Show last quarter’s budget versus actual expenses, department by department.”
Within seconds, a bar chart appears, highlighting overspending areas and opportunities for cost reallocation. Immediate insight leads to faster, informed financial decisions, preventing losses before they occur.
- Human Resources: Proactive Workforce Management
The HR head queries: “Which departments are seeing the highest attrition, and how does this compare to hiring patterns?”
A line graph appears, revealing trends and potential risks. HR can act proactively, targeting retention strategies before critical talent is lost.
- Sales and Marketing: Data-Driven Decisions
A sales director asks: “Which regions delivered the highest revenue this quarter?”
The system ranks regions visually, enabling the team to focus on high-growth markets while addressing underperforming areas. Resources are deployed strategically rather than reactively.
- Operations: Identifying Bottlenecks Instantly
The COO wants to know: “Which vendors caused the most delivery delays, and what was the cost impact?”
A graph highlights the vendors responsible and the financial effect, allowing operational adjustments before delays cascade into larger issues. Across departments, Ariel converts data from a passive resource into a proactive tool, empowering leaders to act immediately.
For teams looking to dig even deeper into sales and marketing data, tools like Google BigQuery combined with GA4 offer advanced analysis capabilities. “Unlocking Hidden Insights: How Google BigQuery Complements GA4” explains how businesses can uncover trends and patterns hidden in their data.
Why Ariel Matters: Strategic Payoff
The RAG Graph System doesn’t just answer questions it drives tangible business outcomes:
- Faster Decisions: Insights are delivered in minutes, allowing leadership to act before opportunities are lost.
- Accuracy and Trust: Answers are grounded in real-time company data, reducing risk and ensuring confidence.
- Universal Access: Anyone, regardless of technical skill, can access insights.
- Collaborative Advantage: Graphs and visualizations are shareable across teams, aligning decisions organization-wide.
- Operational Efficiency: Reduces reliance on manual BI processes, cutting time and costs.
Gartner reports that up to 80% of enterprise data goes unused because employees can’t access it quickly. Ariel’s system converts dormant information into a competitive advantage.
Technical Excellence Behind the Scenes
Ariel’s system isn’t just user-friendly it’s technically robust:
- Large Language Model Integration: Understands natural language queries and delivers contextually relevant answers.
- Vector Databases: Embed company data for precise, rapid retrieval.
- Graph-Based Retrieval: Maps relationships between data points for complex, multi-layered queries.
- Enterprise Security: Data remains within secure, private environments, never exposed to public models.
- Scalable Architecture: Integrates seamlessly with ERP, CRM, HRMS, and other enterprise systems.
By combining technical sophistication with intuitive usability, Ariel delivers a solution that executives trust and IT teams approve.
Efficient data extraction is critical for accurate insights. Technologies like OCR are quietly revolutionizing how organizations process information. “The Silent Revolution: How OCR Technology Transforms Data Extraction” dives into how OCR simplifies and automates data capture for smarter business decisions.
Competitive Advantage: Why Ariel Stands Out
Ariel’s RAG Graph System provides measurable advantages over traditional BI tools and generic AI solutions:
- Speed: Real-time insights empower faster, smarter decisions.
- Clarity: Removes dashboard clutter, delivering precise answers in context.
- Empowerment: Every employee can query data independently, democratizing access.
- Future-Proofing: Supports predictive analytics and proactive decision-making as AI evolves.
For industries like finance, healthcare, retail, and manufacturing, this competitive edge is not incremental it’s transformative.
The Future of Conversational Data
The future of enterprise intelligence isn’t static dashboards. It’s conversational and dynamic. Leaders will no longer wait for reports they’ll ask questions and receive instant, actionable answers.
Ariel’s RAG Graph System is the first step toward that future. Today, it provides instant, visualized insights. Tomorrow, it could proactively suggest decisions, highlight risks, and surface opportunities before leadership even thinks to ask.
Take the Leap: Transform Your Data Strategy

Ariel Software Solutions doesn’t just deliver technology it delivers transformation.
With the RAG Graph System, businesses can:
- Ask questions in plain language.
- Retrieve accurate, contextual data instantly.
- Visualize insights dynamically.
- Make confident, timely decisions.
The result is not just faster reports it’s better business outcomes, cost savings, and a competitive edge that grows as data continues to expand.
Book a live demo today to see how Ariel’s RAG Graph System can turn your data into actionable insights, empowering your organization to make smarter, faster decisions.
Frequently Asked Questions (FAQs)
1. What is the RAG Graph System?
The RAG Graph System combines AI with real-time data retrieval to deliver instant, visual business insights. It turns complex data from multiple sources into clear, actionable graphs.
2. How does the RAG Graph System help decision-making?
It provides fast, accurate answers to business questions, reducing delays and enabling leaders to make timely, informed decisions.
3. Can the RAG Graph System support predictive analytics?
Yes. It helps businesses identify trends, forecast outcomes, and plan proactively using predictive analytics for businesses.
4. Which business areas benefit from the RAG Graph System?
Finance, HR, Sales, Marketing, and Operations can all benefit. It helps track expenses, monitor attrition, analyze revenue, and identify operational bottlenecks.
5. Is the RAG Graph System suitable for all industries?
Yes. It works across sectors like finance, healthcare, retail, and manufacturing, providing AI-driven business insights that improve strategy and efficiency.