
76% of organizations now face increased scrutiny on the business impact of Agile, and 63% say they still cannot deliver reliable, high-quality software consistently. Those two numbers reveal a measurement problem, not an execution problem.
Teams optimize for the agile metrics they are scored on, not the outcomes those metrics were supposed to represent. The number goes up, but the software does not get better.
This guide will break down the agile metrics that predict delivery quality, the ones that create dysfunction, and how to build a measurement system your team can trust.
What Agile Metrics Actually Measure (And What They Don’t)
Agile metrics are quantitative indicators that track delivery speed, quality, stability, and team sustainability across sprints. They work when they answer operational questions about flow and stability. They fail when teams treat them as performance scorecards.
1. Why Traditional Output Metrics Fail in Agile
Lines of code, tasks completed, and hours logged tell you how busy a team looks. They say nothing about whether the team delivered value. The SPACE framework research from Microsoft, GitHub, and the University of Victoria proved that no single metric defines productivity and that attempts to reduce it to one number consistently mislead teams.
Story points and velocity were designed as internal forecasting tools for sprint planning. They help a team predict how much work it can take on the next sprint based on past sprints. The problem starts when managers take a planning tool and turn it into a productivity score. A team with higher velocity is not necessarily a better team. It might be a team that learned to estimate higher.
2. The Velocity Trap
The most common agile metrics mistake is treating velocity as a performance indicator. The gaming takes predictable forms: inflated estimates, work sliced into trivial increments, bugs reclassified as features. AI-assisted coding tools make this worse. A team using Copilot or Cursor may complete 30% more story points per sprint.
But if those points map to low-impact features or technical debt that someone else will pay for later, the business gains nothing. Velocity measures movement, not direction. A team can have high velocity and still ship the wrong things, or ship the right things with quality so low that support costs eat the gains.
3. The Right Way to Think About Agile Metrics
Agile metrics should answer three questions:
- How fast are we delivering working software?
- How stable is what we ship?
- How sustainable is our team’s pace?
This maps to a three-dimensional model: speed (predictability and flow), quality (stability and defect rates), and value (team health and customer satisfaction). Any metric system that ignores one of these three dimensions creates blind spots. A team tracking only speed will sacrifice quality. A team tracking only quality will slow down delivery.
The right agile metrics framework tracks all three and looks at the interactions between them. This three-dimensional view is also how you measure agile team productivity without reducing complex team output to a single number.
Next, we’ll cover the specific agile team performance metrics that map to each dimension.
The Agile Team Performance Metrics That Matter in 2026
The most reliable agile team performance metrics in 2026 fall into three categories: delivery speed, quality and stability, and flow visibility. Each category answers a different operational question. Tracking them together prevents the gaming that single-metric systems create.
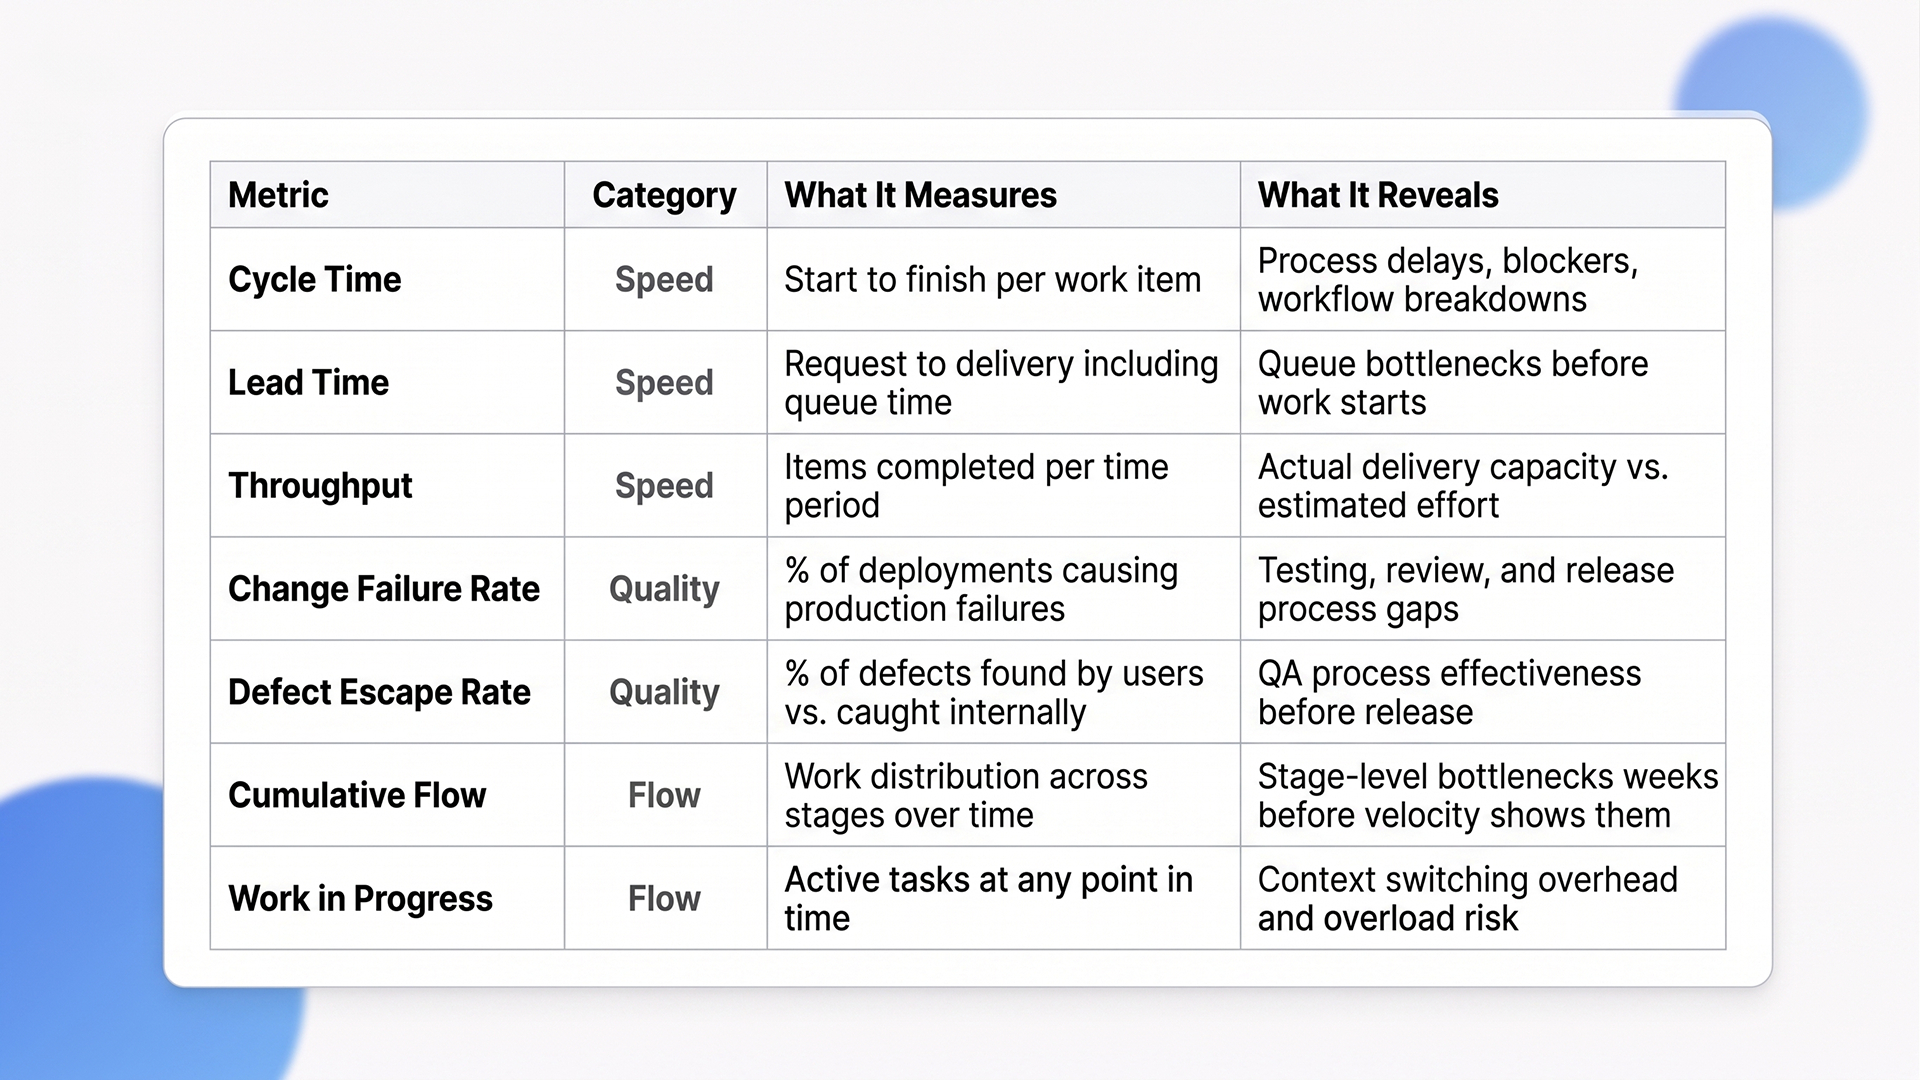
Agile Metrics at a Glance:
1. Delivery Speed Metrics
Speed-focused agile metrics answer one question: how fast is working software reaching users?
A) Cycle Time: Time from when work starts to when it is done. This is the single most useful flow metric because it captures delays, blockers, and process breakdowns in one number. Unlike velocity, cycle time is almost impossible to game because it measures calendar time, not estimated effort.
B) Lead Time: Time from request to delivery. Lead time includes queue time before work begins, which is the detail that makes it different from cycle time. If your lead time is 10 days but your cycle time is 3 days, you have a 7-day queue problem, not a speed problem. Most teams that think they need to work faster actually need to start work sooner.
C) Throughput: Number of items completed per unit of time. More useful than velocity because throughput counts actual delivered items rather than estimated points. You cannot inflate real completions the way you can inflate story point estimates.
2. Quality and Stability Metrics
Quality-focused agile team performance metrics answer: how reliable is what we ship?
A) Change Failure Rate: Percentage of deployments causing production failures. This metric is the quality counterweight to speed indicators. A team deploying daily with a 25% failure rate is creating more problems than it solves.
B) Defect Escape Rate (DER): Percentage of defects found by users vs. defects caught internally before release. A high DER means your testing and review processes are missing issues that reach production. The connection to sprint planning is direct: teams that estimate workload using full Scrum practices produce 250% higher work quality than teams that skip estimation.
Estimation forces teams to think through complexity before they start coding, which reduces the kinds of shallow errors that escape to users.
Flow and Bottleneck Metrics
Flow-focused agile metrics answer: where is work getting stuck?
A) Cumulative Flow Diagram (CFD): A visual tool showing work in each stage over time. A widening band signals a bottleneck in that stage. CFDs catch process breakdowns weeks before they show up in velocity numbers, which makes them a leading indicator rather than a lagging one.
B) Work in Progress (WIP): Number of active tasks at any time. High WIP correlates directly with longer lead time and increased context switching. Reducing WIP speeds up delivery and protects the 68% of time that teams lose to overhead.
These agile team performance metrics form the operational layer. The next covers the frameworks that structure them into actionable systems to measure agile team productivity across multiple dimensions.
DORA and SPACE: The Measurement Frameworks Behind Modern Agile Metrics
DORA metrics and the SPACE framework are the two measurement systems that structure how high-performing teams track agile metrics in 2026. DORA covers delivery pipeline performance. SPACE adds human factors that determine whether high performance is sustainable or burns teams out within quarters.
1. DORA Metrics for Delivery Performance
Four agile metrics define DORA: Deployment Frequency, Lead Time for Changes, Change Failure Rate, and Failed Deployment Recovery Time. According to the 2025 DORA benchmarks, elite performers (top 15%) deploy on demand (multiple times per day), maintain change lead times under one day, and keep failure rates below 5% (Multitudes, 2025).
DORA works best for measuring pipeline efficiency. It answers: how well do we ship? But it does not capture why a team ships well or poorly. A team with strong DORA numbers can still have high attrition, low morale, and unsustainable hours. That is where SPACE fills the gap.
2. SPACE Framework for Measuring Agile Team Productivity
Five dimensions: Satisfaction and well-being, Performance, Activity, Communication and collaboration, Efficiency and flow. SPACE was created because DORA alone misses the human factors that determine whether a team can sustain its delivery over months rather than only sprints. SPACE provides the framework to measure agile team productivity across both technical and human dimensions.
The SPACEX study (2025) demonstrated that productivity signals only emerge when multiple dimensions are analyzed together. Activity agile metrics alone (commits, PRs, story points) miss the picture. Collaboration and satisfaction need to be included alongside activity data for a meaningful productivity signal to appear. This is the research-backed argument against tracking any single metric in isolation.
3. How to Use Them Together
Start with DORA to establish delivery pipeline baselines. Expand to SPACE for a complete view of engineering health. Teams evaluated solely on velocity showed no statistically significant improvement in business outcomes.
The pattern is clear: satisfaction predicts business results better than velocity does.
“Data-driven decision-making extends beyond DevOps into every facet of the enterprise, a shift we break down in Future of ERP 2025: AI and Machine Learning: Navigating the Next Era of Business Intelligence.”
Knowing the frameworks is half the battle. The next part covers how to implement agile metrics without creating the dysfunction they are supposed to prevent.
How to Implement Agile Metrics Without Creating Dysfunction
The gap between tracking agile metrics and getting value from them comes down to implementation. Most teams fail here. They pick the right metrics, then misuse them by tying them to individual reviews, reacting to single sprints, or ignoring qualitative context. The goal is to measure agile team productivity in a way that improves decisions, not creates fear.
Implementation Quick Steps
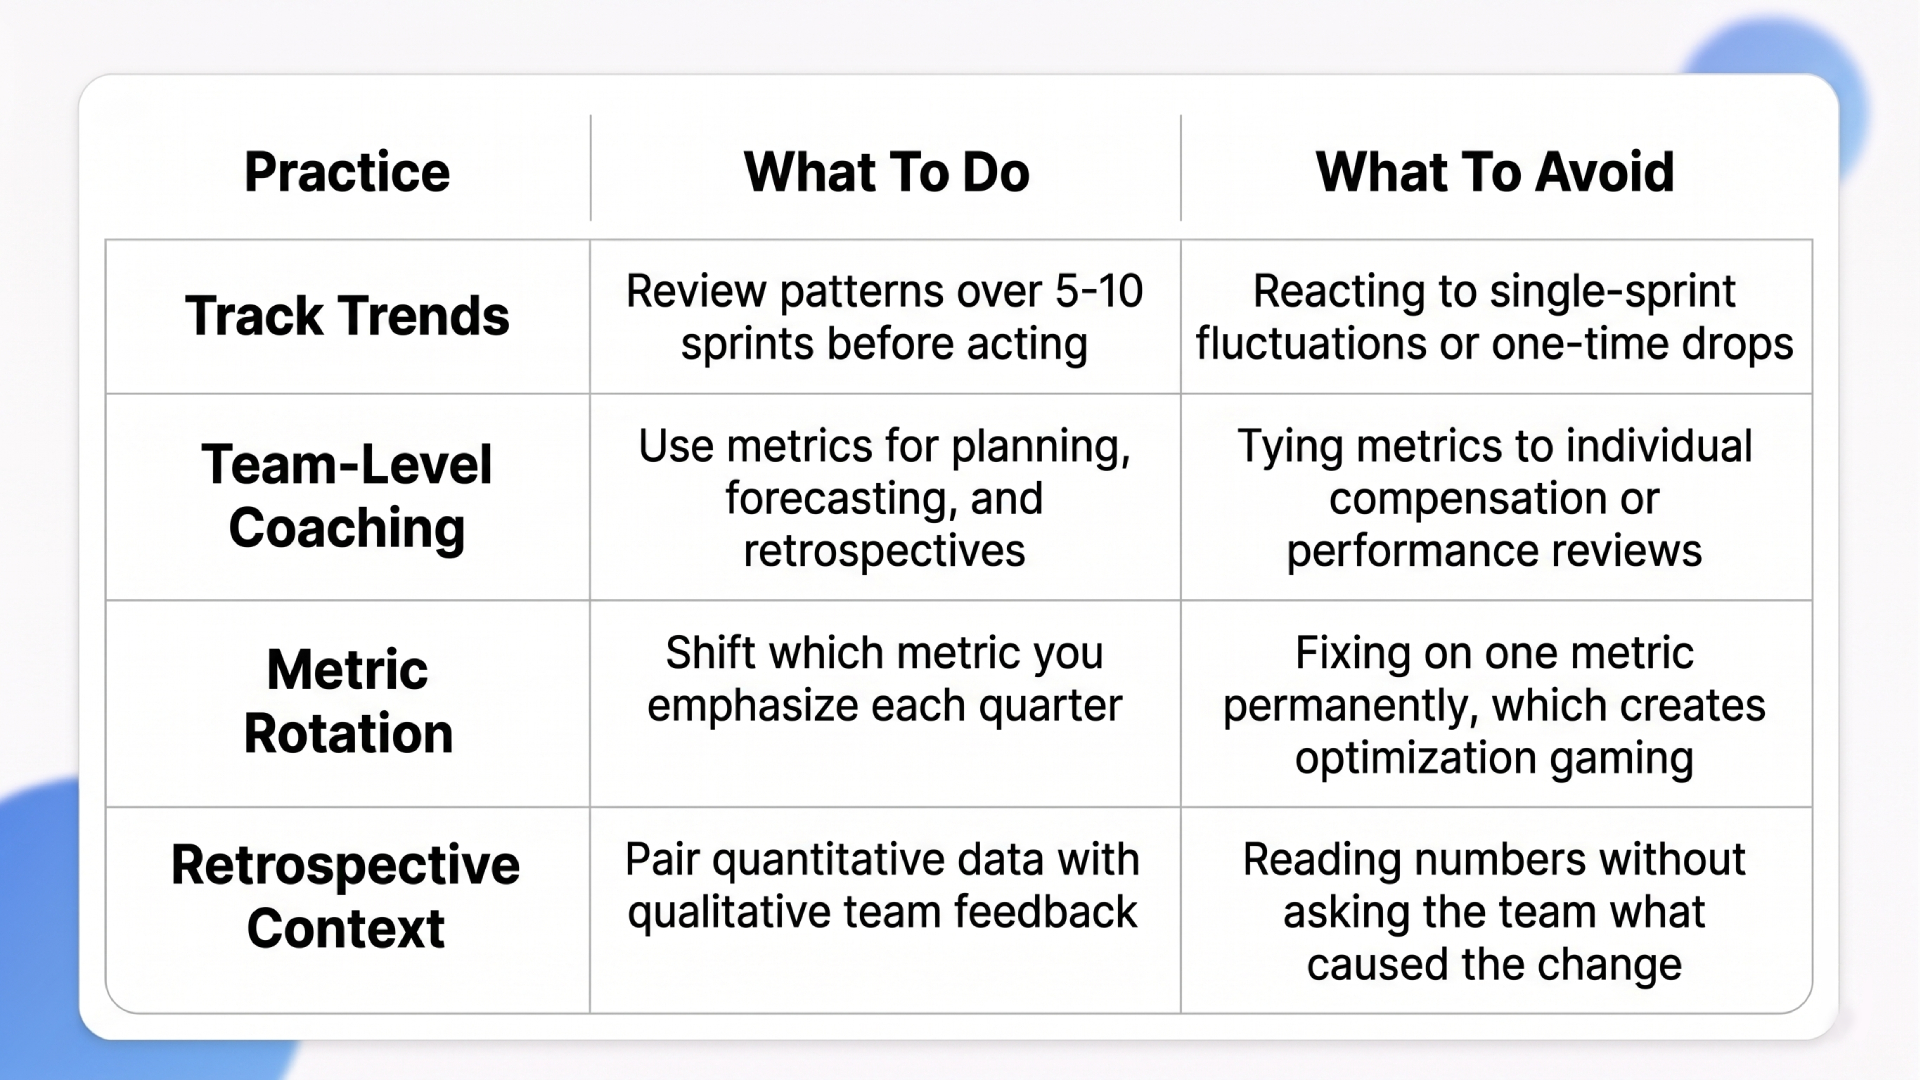
1. Track Trends, Not Absolutes
No single sprint’s numbers matter. Patterns over 5-10 sprints reveal real performance. A one-time velocity drop means nothing. A three-sprint declining trend in throughput signals a real problem. This distinction changes how you run sprint reviews: instead of asking “why was velocity lower this sprint?” ask “what trend are we seeing over the last five sprints, and what changed?”
Comparing velocity across different teams is always misleading because each team estimates differently. Two teams with identical velocity numbers can have completely different output quality and delivery speed. Use velocity within a team for forecasting. Use agile metrics like cycle time and throughput for cross-team comparison.
“Integrating metrics with design matters. For a closer look at how sprint planning and visualization work within Microsoft’s ecosystem, check out our guide on Agile UI Design & Azure DevOps.”
Never Tie Metrics to Individual Performance Reviews
This is the single fastest way to destroy the usefulness of any agile metrics system. The moment an individual’s compensation depends on a number, that number stops being accurate.
Use agile metrics for team-level coaching, not individual scoring. Rotate which metrics you emphasize each quarter. If you focus on cycle time for Q1, shift emphasis to change failure rate in Q2. Rotation prevents the optimization gaming that happens when teams know exactly which number matters most.
Use Retrospectives to Give Metrics Context
Metrics show what happened. Retrospectives explain why. Quantitative data without qualitative feedback creates incomplete pictures. A rising cycle time could mean the team is struggling with technical debt, or it could mean they took on a deliberately complex feature that required more careful work. Only the team knows which one it is.
Combine quantitative agile metrics (cycle time, change failure rate) with qualitative feedback (developer satisfaction, blockers) for full context. Google’s Project Aristotle found that psychological safety is the top predictor of team effectiveness. Teams that feel safe discussing why a metric moved perform better over time than teams that only get asked to explain why a metric dropped.
How Ariel Software Solutions Builds Agile Teams That Deliver Measurably Better, Sprint After Sprint

Velocity gaming, single-metric blind spots, disconnected delivery data. These problems all stem from the same root cause: measurement gets added after the process is already broken. Ariel Software Solutions solves this by treating measurement as an engineering problem, not a reporting problem.
Across 1,100+ projects and 16+ years of delivery in healthcare, logistics, and financial services, our teams embed cycle time tracking, WIP limits, and DORA metrics monitoring as default infrastructure from sprint one. Automated testing pipelines keep defect escape rates low. Sprint retrospectives pair hard delivery data with team feedback so the numbers have context and the context has evidence.
Talk to Ariel’s engineering team to see how measurement-driven Agile delivery works at scale.
Conclusion
Agile metrics work when they cover three dimensions together: delivery flow, quality stability, and team health. The teams producing the best results in 2026 combine quantitative delivery data (DORA) with collaboration and satisfaction signals (SPACE), and they use retrospectives to translate numbers into decisions.
The shift ahead is from measurement as reporting to measurement as coaching. Organizations that measure agile team productivity this way will retain better engineers, ship more reliably, and stop losing months to metric dysfunction.
Let’s talk Ariel builds measurement into the delivery process from sprint one. Book a quick walkthrough to see how it fits your team.
Frequently Asked Questions
1. What are the most important agile metrics to track?
The most useful agile metrics are cycle time, throughput, change failure rate, and lead time. These four agile team performance metrics cover speed, quality, and flow. Track them alongside team satisfaction surveys. Avoid relying on velocity as your primary indicator because it measures estimated effort, not delivered value.
2. Why is velocity considered a poor agile metric?
Velocity was designed for sprint forecasting, not performance measurement. When velocity gets tied to reviews, teams inflate it. They increase point estimates, split work into trivial items, or reclassify bugs. AI coding tools further distort velocity without delivering proportional business value.
3. What is the difference between DORA and SPACE metrics?
DORA measures DevOps delivery performance: deployment frequency, lead time, change failure rate, and recovery time. SPACE measures broader developer productivity across five dimensions: satisfaction, performance, activity, communication, and efficiency. DORA tells you how well you ship. SPACE tells you why your team performs the way it does. Together, they provide the full picture for tracking agile metrics at scale.
4. How often should you review agile metrics?
Review operational agile metrics (cycle time, WIP, throughput) every sprint. Review DORA metrics monthly. Review team health and satisfaction metrics quarterly. Look for trends over 5-10 sprints rather than reacting to single data points. Use retrospectives to add qualitative context to the numbers.
5. What is cycle time vs. lead time in agile?
Cycle time measures the duration from when work begins (status moves to “in progress”) to completion. Lead time measures the total time from request to delivery, including queue time before work starts. If lead time is much longer than cycle time, the bottleneck is in the queue, not the work itself. Both are more reliable agile metrics than velocity for measuring delivery speed.
6. How do you measure agile team productivity without hurting morale?
To measure agile team productivity sustainably, use team-level metrics rather than individual rankings. Combine delivery data (cycle time, throughput) with satisfaction surveys and retrospective feedback. Never tie agile metrics to compensation. Rotate which metrics you emphasize each quarter to prevent optimization gaming.