
Key Takeaway: A DevOps pipeline automates code movement from commit to production through build, test, security, and deployment stages. Elite teams achieve 182x more deployments and 8x lower change failure rates than low performers. The differentiator in 2026 is not tooling. It is a measurement discipline and environment parity.
The DevOps pipeline market is valued at $19.57 billion in 2026, growing at a 21.33% CAGR to reach $51.43 billion by 2031. That growth is not driven by hype. It is driven by the measurable gap between teams that automate their delivery chain and teams that still rely on manual handoffs.
The 2024 DORA Report confirmed that elite performers achieve 182x more deployments than low performers. Most of that gap comes down to how well the DevOps pipeline connects build, test, security, and deployment into a single automated sequence.
This guide will explain what a DevOps pipeline is, break down each CI/CD pipeline stage, compare the top DevOps pipeline tools, and walk through how to build one that produces measurable improvements in deployment speed and stability.
What Is a DevOps Pipeline and Why It Matters in 2026
A DevOps pipeline is an automated workflow that moves code from a developer’s commit through build, test, security scan, and deployment stages to production, removing manual handoffs between development and operations teams.
A) Definition and Core Function
The pipeline is the automation engine. DevOps is the operating model wrapped around it. A CI/CD pipeline handles continuous integration (merging and validating code changes) and continuous delivery (pushing validated code to staging or production). The pipeline runs a defined sequence: compile, test, scan, deploy. Every step either passes or blocks the release.
What separates a functional pipeline from a broken one is how tightly each stage connects. If the build stage produces inconsistent artifacts, the test stage catches phantom failures, and the deployment stage becomes a guessing game, the whole pipeline loses reliability. Each stage depends on the output quality of the one before it.
B) What DevOps Pipelines Actually Solve
The problems are specific: manual deployments that consume hours, inconsistent environments between dev and production, late-stage bug discovery, and slow rollback from failures. A DevOps pipeline eliminates each of these by enforcing automated, repeatable steps between code commit and production.
Teams with fewer, well-integrated DevOps pipeline tools are 5x more likely to deploy releases within an hour compared to teams running too many overlapping tools. Tool sprawl is one of the biggest DevOps pipeline bottlenecks. Fewer tools with deeper integration consistently outperform a scattered collection of dashboards.
Understanding these problems frames the stages that follow.
The 7 CI/CD Pipeline Stages Every Team Needs
Every functional DevOps pipeline runs through seven CI/CD pipeline stages in sequence: source control, build, automated testing, security scanning, staging deployment, production deployment, and monitoring. Skipping any stage increases failure rates and recovery time.
CI/CD Pipeline Stages at a Glance
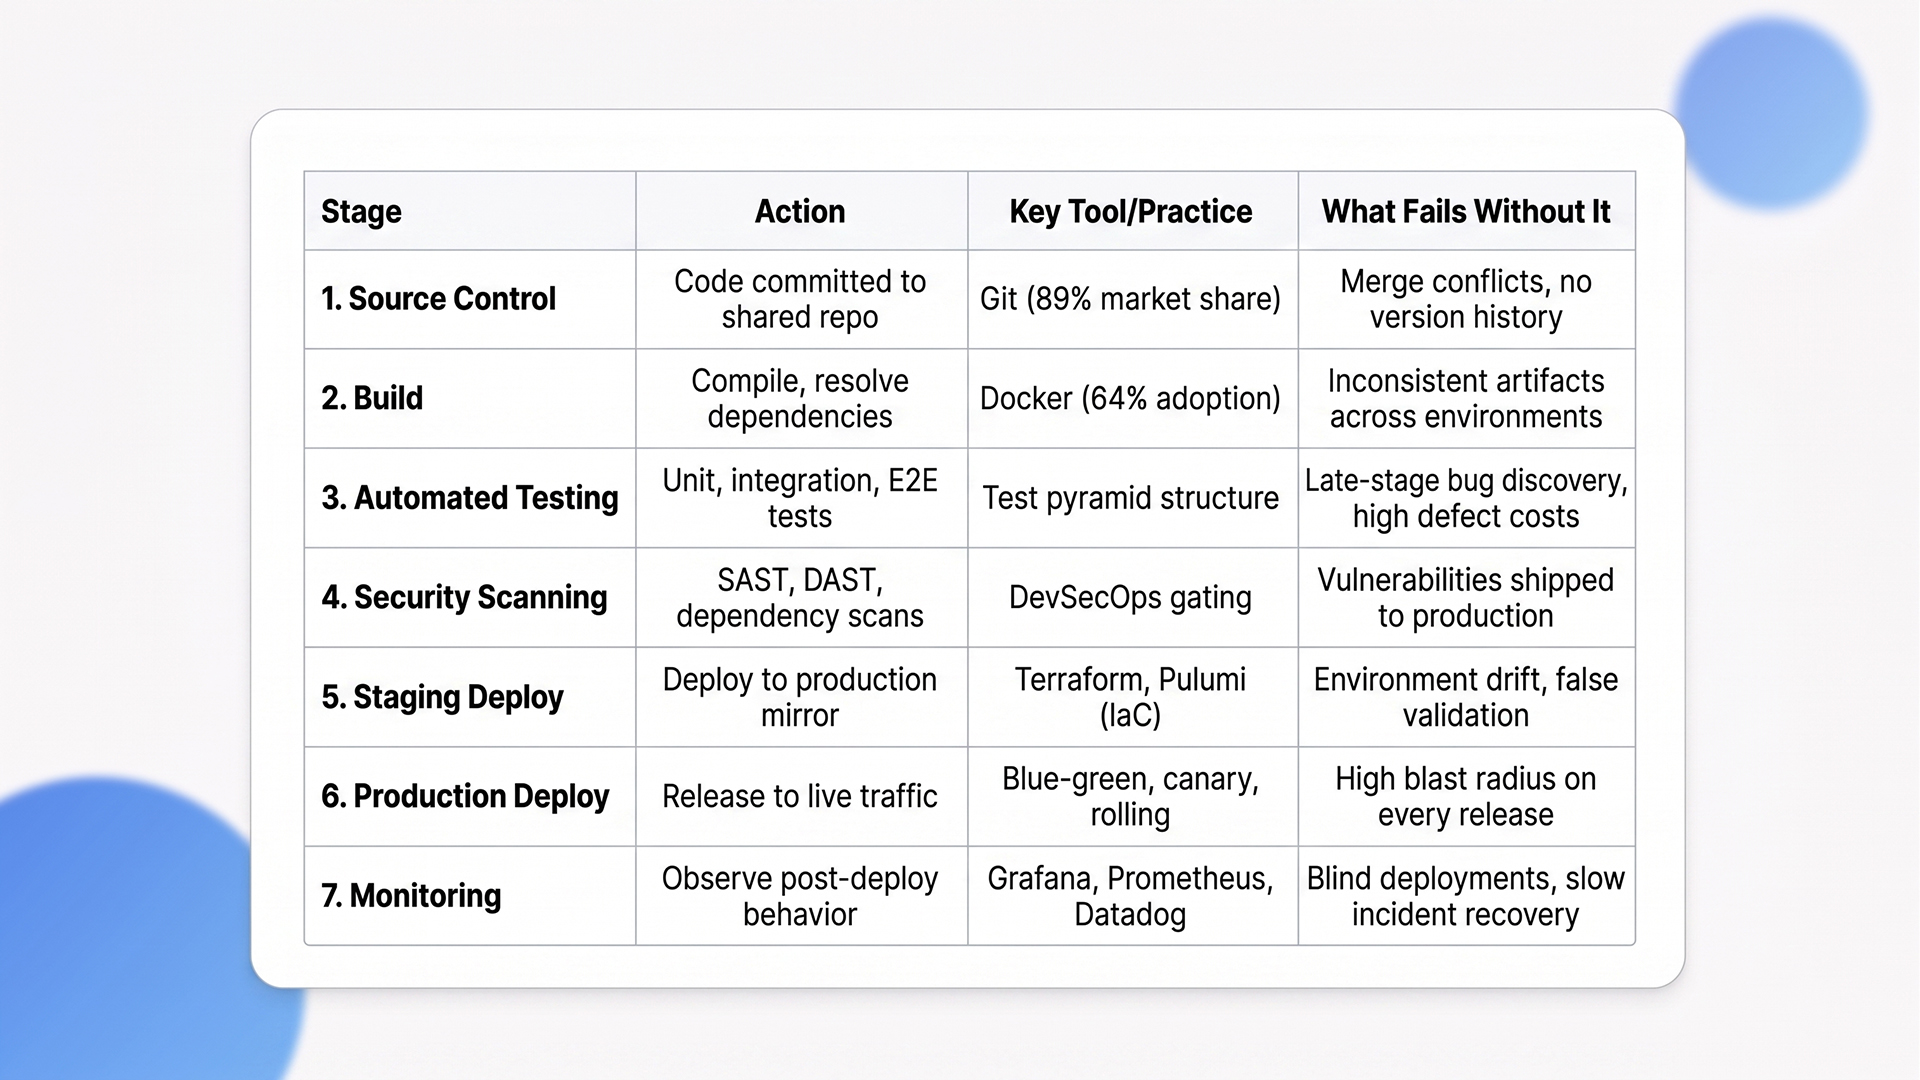
Stage 1: Source Control and Code Commit
Developers push code to a shared repository. Git holds 89.07% of the version control market. Branching strategy matters here. Trunk-based development keeps branches short-lived and merge conflicts minimal. Feature branching works for larger teams but slows lead time if branches stay open beyond a day or two.
Commit frequency directly correlates with deployment frequency. Teams that commit in small batches multiple times per day catch integration issues within minutes instead of discovering them during a weekly merge. This is the first DORA metric that separates elite teams from the rest.
Stage 2: Build
Code is compiled, dependencies are resolved, and artifacts are produced. Docker is used by 64% of developers for containerized builds.
Reproducible builds are non-negotiable because inconsistent artifacts between environments are the root cause of “works on my machine” failures. If your build step produces different outputs depending on when or where it runs, every downstream stage inherits that inconsistency. Containerized builds solve this by packaging the application and its dependencies into an identical image every time.
Stage 3: Automated Testing
Unit tests, integration tests, and end-to-end (E2E) tests run automatically against every build. Earlier defect detection through continuous integration testing reduces quality-related costs by an estimated 60%, according to market analyst projections.
Follow the test pyramid: many fast unit tests at the base, fewer integration tests in the middle, and minimal E2E tests at the top. Teams that invert this pyramid spend more time debugging flaky tests than shipping code.
The pyramid is not just a best practice diagram. It is a resource allocation strategy. Every slow E2E test that could have been a unit test adds minutes to the feedback loop and hours to the weekly runtime.
Stage 4: Security Scanning (DevSecOps)
Security is a built-in CI/CD pipeline stage, not a separate phase. The DevSecOps market continues to grow, driven primarily by cloud-native application adoption and secure CI/CD automation demands.
SAST (static analysis), DAST (dynamic analysis), dependency scanning, and container image scanning should all gate the pipeline. If a security scan fails, the deployment stops. No exceptions. Security gates that produce warnings instead of blocks are decorative, not functional.
The cost of a vulnerability caught in production is 10x to 100x higher than one caught during build. Gating on security results is not optional for any team running production workloads.
Stage 5: Deployment to Staging
Artifacts deploy to a staging environment that mirrors production. Infrastructure as code tools like Terraform and Pulumi make environment parity reproducible and auditable.
If staging and production differ in configuration, load balancer rules, or database versions, staging validation is meaningless. The gap between staging and production is where most production incidents originate. Environment drift is not a minor detail.
It is the reason teams discover critical bugs only after a release goes live. IaC eliminates this by defining environments in version-controlled templates that guarantee consistency across every deployment target.
Stage 6: Deployment to Production
Production deployment is where pipeline maturity shows. Source-control management and CI/CD together deliver 40% higher release throughput and 25% lower error incidence.
Three deployment strategies dominate. Rolling updates replace instances gradually and work for stateless services. Blue-green deployments maintain parallel environments and allow instant switch-back if something breaks. Canary releases shift a small percentage of traffic first and monitor error rates before full rollout.
The right choice depends on rollback speed tolerance, traffic volume, and whether your application maintains session state. Teams that default to big-bang releases are accepting unnecessary blast radius on every deployment.
Stage 7: Monitoring and Feedback
Post-deployment monitoring closes the feedback loop. 73% of teams take several hours to resolve production issues, and only 14% are satisfied with their mean time to recover.
The standard observability stack includes Grafana, Prometheus, and Datadog. Monitoring is where the pipeline feeds back into itself. Without it, you are deploying blind. Effective monitoring goes beyond uptime checks. It covers latency percentiles, error rate spikes, resource saturation, and business-level metrics like transaction completion rates. Teams that only monitor CPU and memory miss the signals that matter to users.
“Maximizing release throughput on Azure requires deep tool integration. Our dedicated guide to CI/CD Pipelines with Azure DevOps explores best practices for building production-grade automation within the Microsoft environment.”
With all seven CI/CD pipeline stages mapped, the next question is which tools run them.
DevOps Pipeline Tools: What Teams Are Actually Using in 2026
DevOps pipeline tools in 2026 are selected based on ecosystem fit, not feature checklists. The teams with the fastest pipelines use fewer tools that integrate deeply with their existing repositories and cloud providers.
Top 7 DevOps Pipeline Tools: Quick Comparison
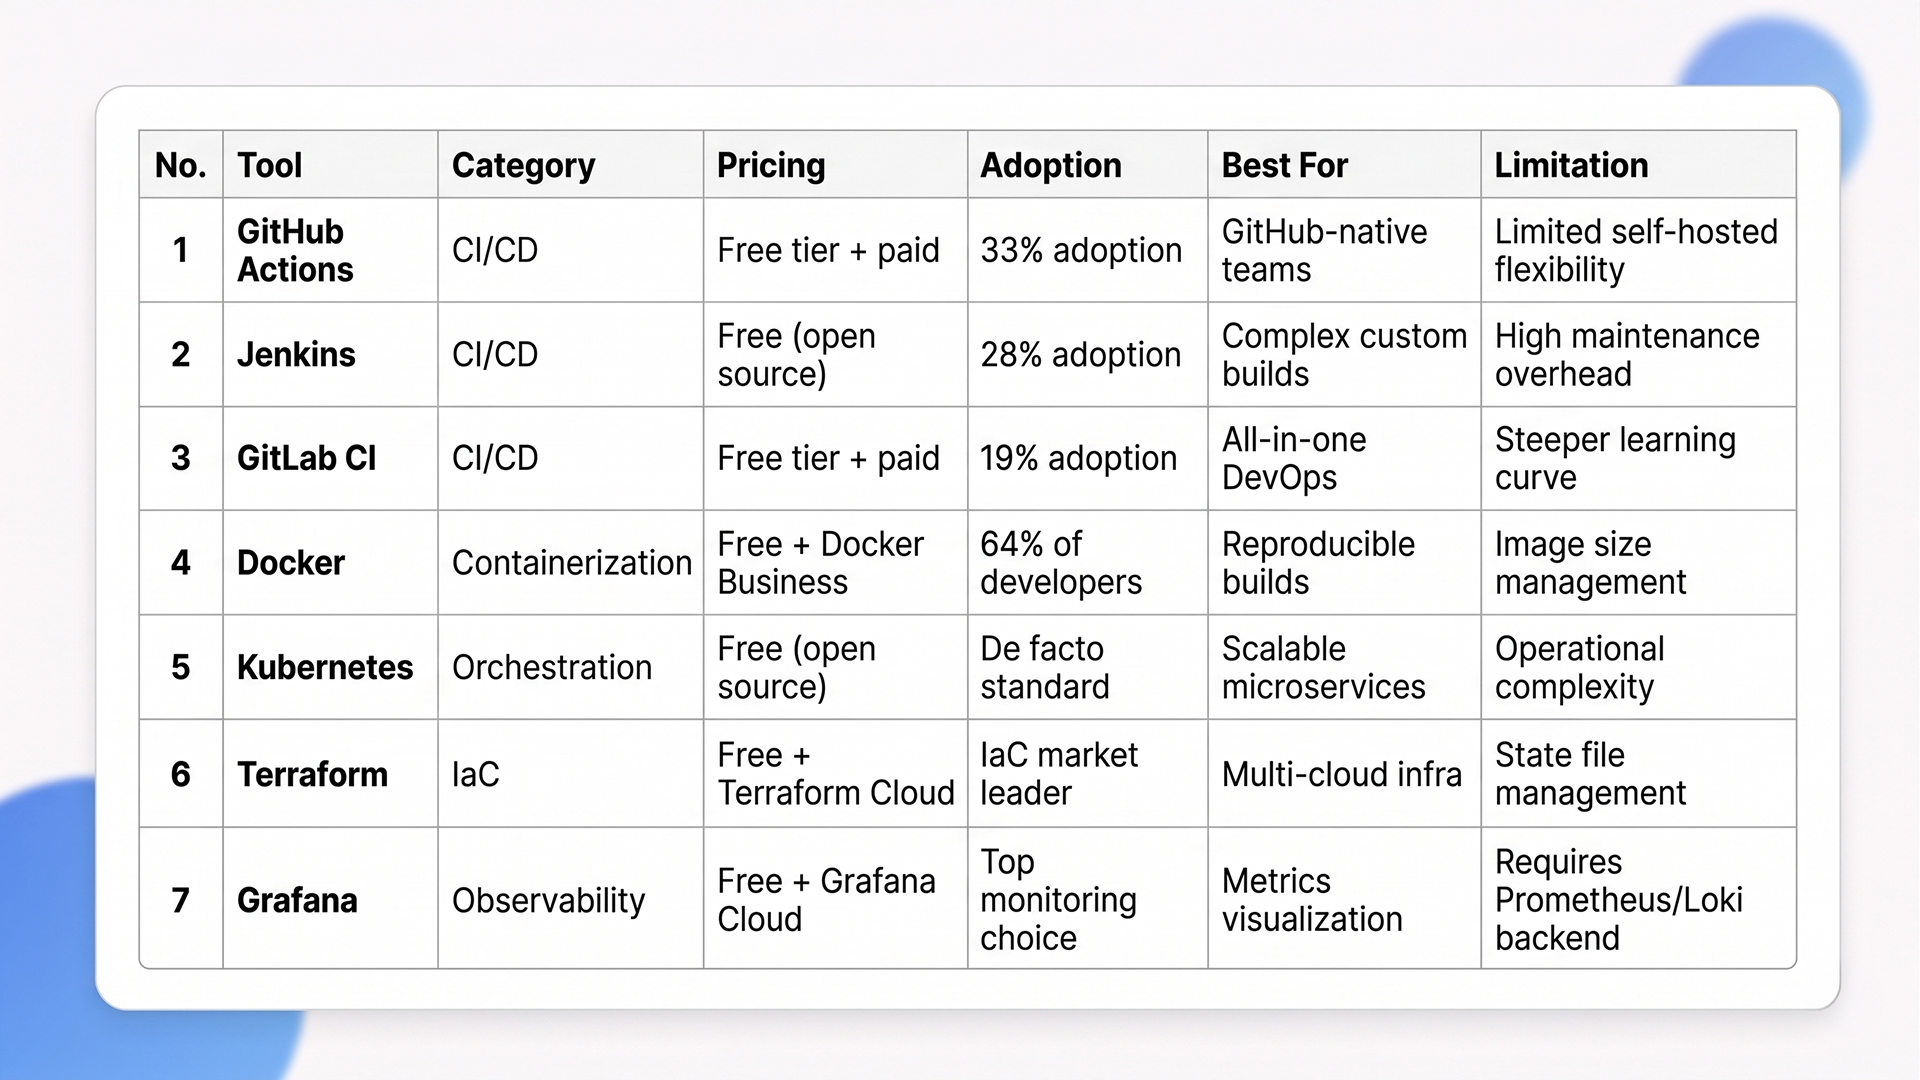
1. CI/CD Platforms
55% of developers regularly use CI/CD tools. GitHub Actions leads adoption at 33%, followed by Jenkins at 28% and GitLab CI at 19%. Note that separate market share analyses measuring installed base put Jenkins higher, but active adoption data from developer surveys tells a different story. GitHub Actions is growing because it runs inside the same platform where code already lives. Jenkins still makes sense for teams with complex, self-hosted build chains and heavy customization needs.
The decision factor is ecosystem alignment. As the JetBrains CI/CD Survey put it: “CI/CD adoption is often about aligning with the broader ecosystem that a team is already committed to, not choosing the ‘best’ technology in isolation”. Teams that pick DevOps pipeline tools based on feature comparison charts instead of repo and project management integration end up fighting their own pipeline.
2. Container Orchestration
Kubernetes is the default for container orchestration, handling AI workloads alongside traditional microservices. It manages scaling, rolling deployments, and self-healing across clusters.
Most teams run Kubernetes through managed services (EKS, AKS, GKE) rather than self-hosting. This trades some control for significantly reduced operational overhead. Self-managed Kubernetes clusters require dedicated platform engineering resources that most teams under 50 engineers cannot justify.
3. Infrastructure as Code
Terraform leads IaC adoption, ensuring environment consistency and enabling GitOps workflows where infrastructure changes follow the same review process as application code. GitOps adoption reached 64% of organizations by 2025, with 81% of adopters reporting higher infrastructure reliability and faster rollbacks.
IaC makes infrastructure changes auditable, repeatable, and version-controlled. The real value is not just consistency. It is that every infrastructure change becomes a reviewable pull request, with the same approval workflow as application code. Teams that manage infrastructure through clickops (manual console changes) cannot reproduce their environments reliably and lose hours during incident recovery.
4. Observability and Monitoring
Top tools for observability include Grafana, Prometheus, AWS CloudWatch, Datadog, and New Relic. Consolidated observability reduces alert fatigue and improves MTTR. Running five monitoring tools that each show a partial picture is worse than running two that cover the full stack.
The goal is a single pane of glass that correlates logs, metrics, and traces. Teams that achieve this resolve incidents in minutes instead of hours because they can trace a user-facing error back to a specific commit and deployment.
“Scaling deployment frequency across hybrid environments requires a robust cloud strategy. Learn how modern infrastructure supports these goals in our deep dive, CI/CD Pipelines in the Cloud Era: AWS & Azure DevOps.”
Tooling decisions are only half the equation. Measuring pipeline performance determines whether those tools deliver results.
How to Measure Your DevOps Pipeline With DORA Metrics
DORA metrics are the standard measurement framework for DevOps pipeline performance. Four metrics tell you whether your pipeline is actually producing value or running pipeline automation for the sake of it.
DORA Metrics: Quick Reference
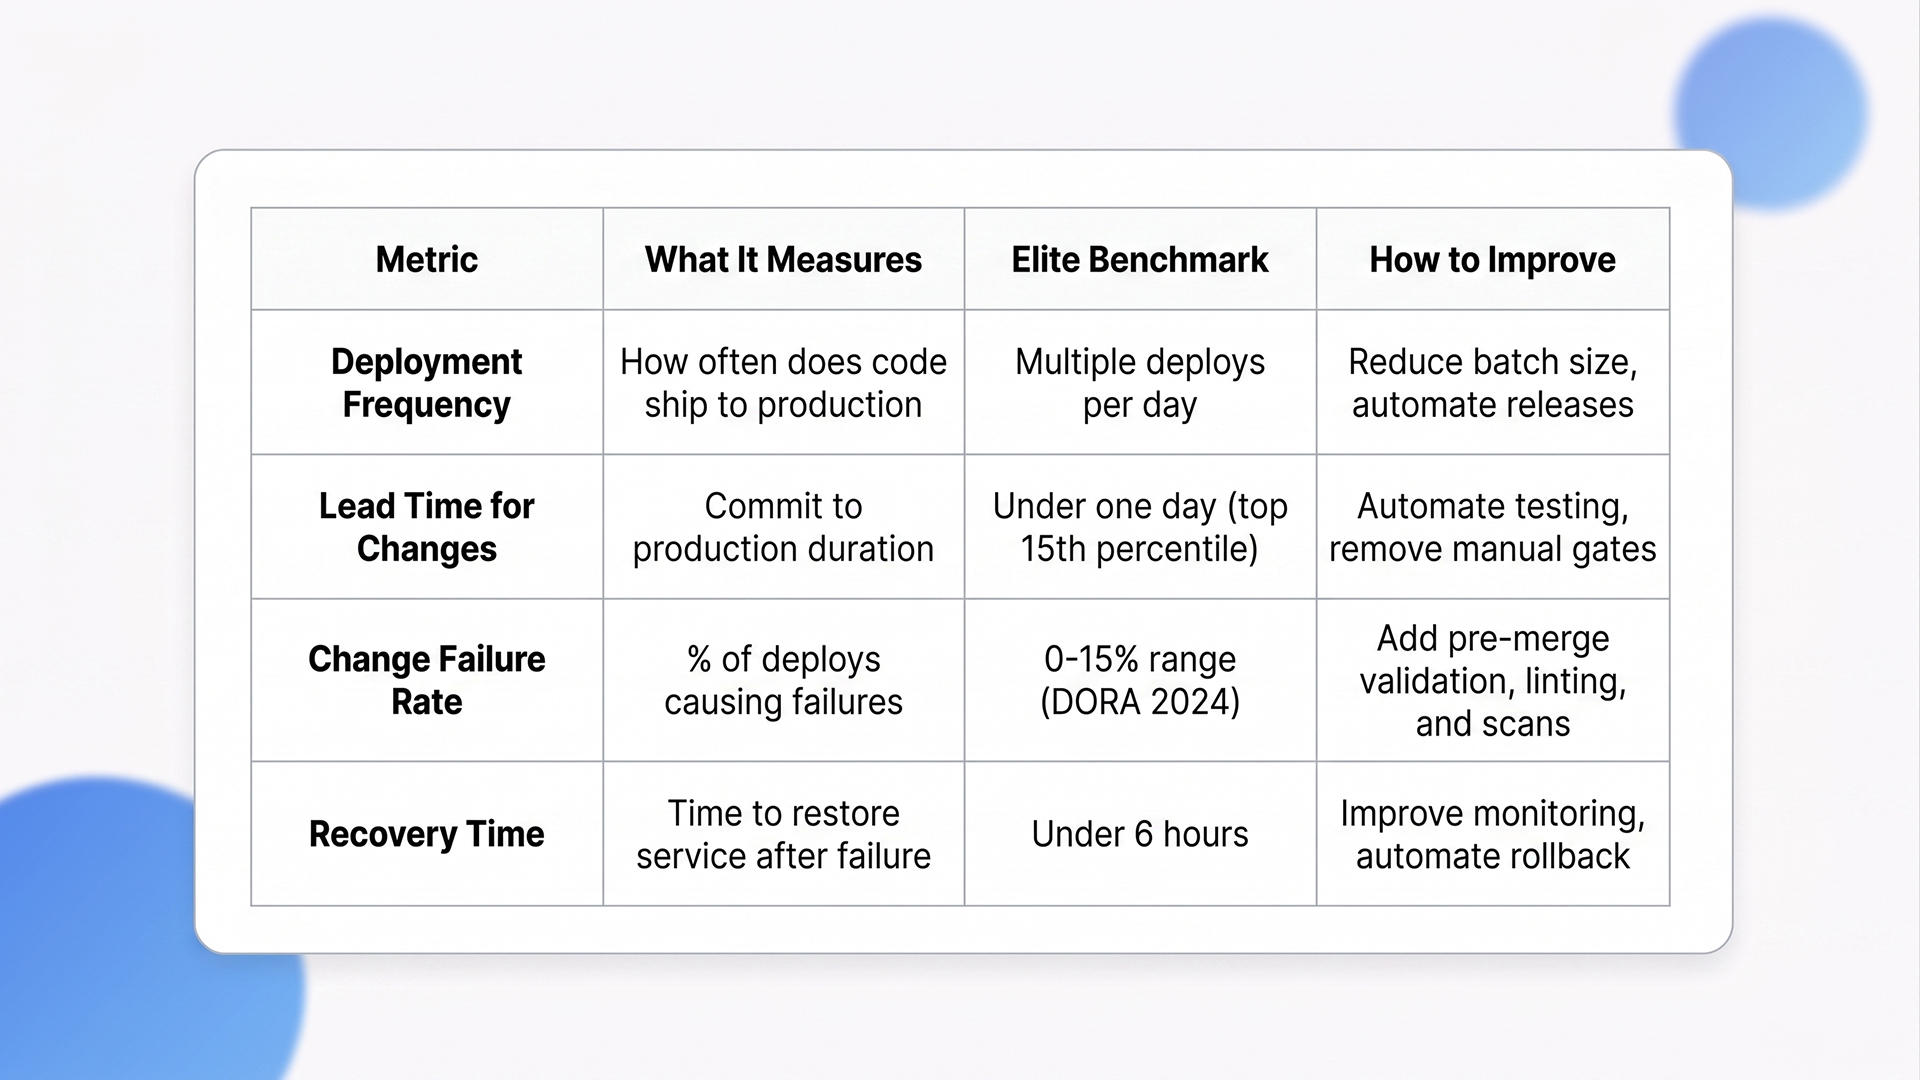
1. The Four DORA Metrics Explained
A) Deployment Frequency: How often code ships to production. Elite teams deploy multiple times per day. This metric reflects batch size discipline. High frequency means small changes, faster feedback, and lower risk per release.
B) Lead Time for Changes: Time from code commit to production. The 2024 DORA Report shows elite performers achieve lead times in the top 15th percentile, typically under one day. Shorter lead times mean developers see the impact of their code faster, which tightens the feedback loop between writing code and learning from production behavior.
C) Change Failure Rate (CFR): Percentage of deployments causing production failures. Official DORA benchmarks place elite and high-performing teams in the 0 to 15% range. The 2025 DORA framework moved away from fixed tier thresholds to percentile distributions, making cross-team comparison more nuanced.
D) Failed Deployment Recovery Time: How quickly the team restores service after failure. Elite teams recover within hours. This metric is directly tied to monitoring quality, runbook coverage, and rollback automation. Teams without automated rollback capabilities consistently measure recovery in days, not hours.
2. Why AI Has Not Changed the Fundamentals
The 2025 DORA Report found that AI functions as an amplifier of existing strengths and weaknesses, not a fix for broken pipeline processes. Teams that adopt AI without a strong user focus actually see performance decline. Elite performers scoring well on DORA metrics are 2x more likely to meet or exceed organizational performance targets.
AI does not fix a bad DevOps pipeline. It makes a good pipeline faster and a bad one more unpredictable. AI-powered test selection, risk-based change scoring, and automated rollback triggers only work when the underlying CI/CD stages are solid. Teams rushing to add AI copilots to broken CI/CD workflows are automating their problems, not solving them.
3. Practical Steps to Improve Each Metric
Reduce batch size to increase deployment frequency. Smaller changes ship faster, fail less often, and are easier to debug when something goes wrong. A 500-line pull request is 10x harder to review and 10x more likely to introduce regressions than a 50-line one.
Automate testing to shorten lead time. Manual QA gates are the biggest bottleneck in most pipeline setups. Every manual approval step adds hours of wait time that compounds across dozens of daily deployments.
Add automated code validation to lower the change failure rate. Linting, type checking, and security scans before merge catch the majority of preventable failures before they reach production.
Improve monitoring and alerting to speed recovery time. Runbooks that are up to date and accessible during incidents cut MTTR more than any single monitoring tool.
How Ariel Software Solutions Handles CI/CD Setup, Tool Selection, and Pipeline Optimization
Ariel Software Solutions builds DevOps pipeline architectures that solve the three problems most teams struggle with: environment drift between staging and production, slow feedback loops from poorly structured test suites, and manual deployment processes that introduce human error at the worst possible moment.
Our engineering teams assess your current DORA metrics baselines, map infrastructure gaps, and design CI/CD pipelines matched to your team’s size and operational maturity.
The stack is flexible: Azure, AWS, .NET Core, Python, React, Node.js. The approach is not. Every engagement starts with identifying the specific bottleneck that is costing you the most deployment time, and building the automation layer around that constraint first.
With 15+ years of delivery across healthcare, logistics, financial services, and real estate, Ariel’s DevOps pipeline implementations are designed for teams that need production-grade CI/CD without a 6-month setup timeline.
Book a pipeline assessment with Ariel’s engineering team → Ariel Software Solutions
Conclusion
A DevOps pipeline automates the path from code commit to production deployment. The teams getting the most value from their pipelines measure performance with DORA metrics, consolidate tooling to reduce overhead, and treat security as a built-in stage rather than an afterthought. The technology is mature. The gap is in implementation discipline, environment parity, and observability coverage.
Lets connect with Ariel Software Solutions to audit your current deployment workflow and build a DevOps pipeline designed around your team’s stack and compliance requirements.
Frequently Asked Questions
1. What is a DevOps pipeline in simple terms?
A DevOps pipeline is an automated workflow that moves code from a developer’s commit through build, test, security scan, and deployment stages to production. It removes manual handoffs, catches bugs earlier, and enables teams to deploy code changes multiple times per day instead of waiting weeks for manual release cycles.
2. What are the main CI/CD pipeline stages?
The core CI/CD pipeline stages are source control (code commit), build (compile and package), automated testing (unit, integration, end-to-end), security scanning (SAST, DAST, dependency checks), staging deployment, production deployment, and monitoring/feedback. Each stage runs automatically, and the pipeline stops if any stage fails.
3. What DevOps pipeline tools do most teams use?
GitHub Actions leads CI/CD adoption at 33%, followed by Jenkins at 28% and GitLab CI at 19%. For containers, Docker is used by 64% of developers, and Kubernetes handles orchestration. Terraform dominates infrastructure as code. Monitoring commonly uses Grafana, Prometheus, and Datadog.
4. How much does it cost to set up a DevOps pipeline?
Industry estimates place outsourced DevOps pipeline setup at $10,000 to $30,000 per month, depending on complexity and cloud provider. Cloud-native pipelines using GitHub Actions or GitLab CI have lower entry costs but require internal DevOps expertise. The highest hidden cost is engineer time for ongoing maintenance, not the tooling itself.
5. What are DORA metrics and why do they matter for pipelines?
DORA metrics measure DevOps pipeline performance across four areas: deployment frequency, lead time for changes, change failure rate, and recovery time after failure. Elite teams deploy multiple times daily with lead times under one day and change failure rates in the 0 to 15% range. Teams excelling at these metrics are 2x more likely to hit organizational goals.
6. How does AI affect DevOps pipelines in 2026?
AI adoption in the DevOps pipeline CI/CD is growing, with common use cases including intelligent test selection, risk-based change scoring, and automated rollback triggers. The 2025 DORA Report found that AI amplifies existing strengths and weaknesses. Teams with poor pipeline fundamentals see no improvement from AI adoption and can experience performance decline.