One Dashboard for Every Meter, Every Site, Every Signal
We built a real-time monitoring system for a multi-site Bitcoin mining operation. It brings equipment health, grid compliance, weather, and market data into one live view.
- Energy & Mining
- Monitoring Platform
- 7 min read
Stat Strip
The System at a Glance
No One Could See the Whole Operation at Once
Before this dashboard, the ops and engineering team had no single live view of their sites. Power draw, temperature, and outage data existed. No one could open one screen and see it, for every site, right now.
Curtailment programs, dispatch events, weather, and market data all lived somewhere else. Spreadsheets held some of it. Vendor portals held more. The rest sat in physical checks at the meters themselves.
Growing Faster Than the Tools Meant to Watch It
- Slow reaction to equipment issues: Overheating or a rising UPS temperature had no live alert. Problems surfaced only after damage or downtime.
- No fast way to spot outages: A tripped breaker or a cut line got discovered after the fact, then written down.
- Manual work just to stay informed: Checking power draw meant walking to a meter or pulling data by hand. It did not scale as sites and meters grew.
- Disconnected information: Curtailment records, dispatch events, weather, and equipment health each lived somewhere else. Someone had to stitch it together by hand.
- Delayed decisions: Without live, central data, the team often reacted after a problem had already cost money.
Site count grew. Meter count grew. The monitoring tools never grew with them. Each new site added one more disconnected piece instead of plugging into one system.
Seven Screens, One Operation
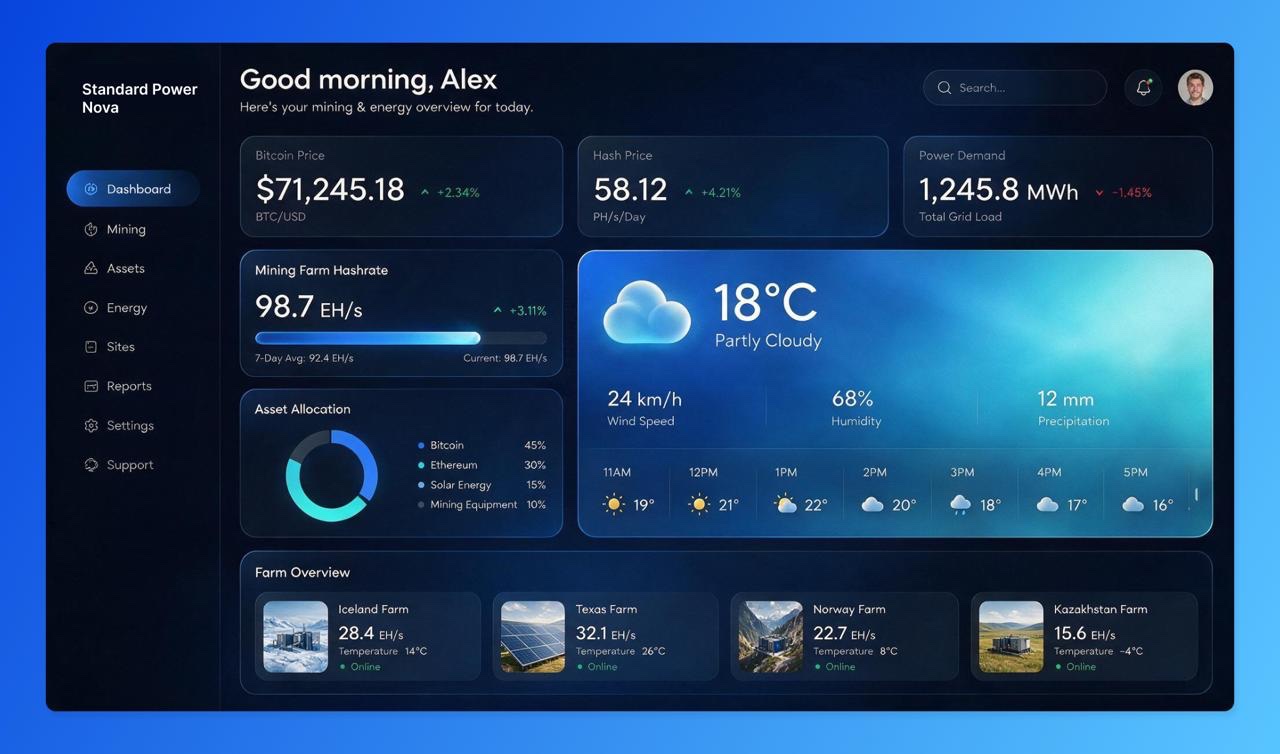
- Home dashboard: Live Bitcoin and hash price with a 7-day average, current electricity demand, live site weather, live temperature readings from critical spots, and a summary of active curtailments, all on one screen.
- Curtailment log: A searchable record of every curtailment event, by year, with start time, end time, duration, site, and program. A clean compliance record, always ready.
- Dispatch events log: Every instruction from the demand-response vendor, with exact timing, program, and commitment level in kilowatts. Proof the site did what it was asked, when it was asked.
- Live power usage tables: Every meter, every site, current draw, and the last reading’s timestamp. Each meter expands into current, voltage, and power factor history.
- Interactive usage charts: Zoomable, 24-hour graphs per meter. Spikes and drops show up at a glance instead of buried in rows of numbers.
- Historical log uploads: A structured way to bring manually extracted meter logs into the same central system, by serial number.
- Configuration settings: Pickaxes, meters, and outages each get their own settings area. Operational staff update details without touching the core system.
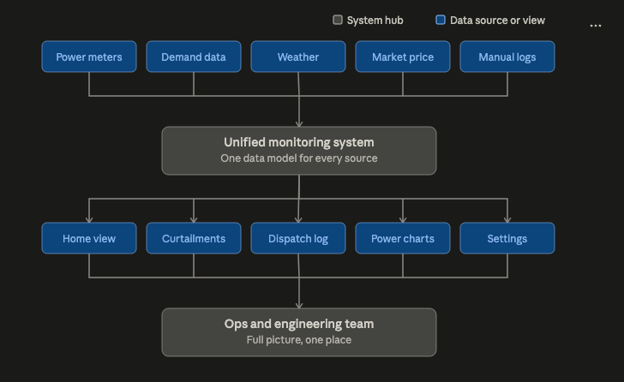
Where the Data Comes From
Built to Grow Site by Site, Meter by Meter
- Meter-based structure: Each meter is its own configurable unit, with its own ID and thresholds. Adding a meter, or a whole site, means adding an entry. Not building something new.
- Site-agnostic design: The dashboard already runs multiple sites side by side, on the same pages. A new site follows the same pattern.
- One data model: Curtailments, dispatch events, meters, and outages all sit in the same system. New data sources plug in without disrupting what’s already there.
- Manual and automated data coexist: Meters that cannot be automated yet still feed the same central system through the upload page. Nothing has to wait for full automation.
- Configuration lives apart from monitoring: Settings for pickaxes, meters, and outages sit in their own area. Operational staff makes changes without needing a developer.
What the Team Sees Now
- Equipment health is now visible live, on one screen, instead of discovered after the fact.
- Curtailment records, dispatch events, meter data, weather, and market context all live in one system.
- Unusual spikes in usage or temperature get caught early, not after the damage is done.
- Every curtailment and dispatch event is logged with exact timestamps, ready for compliance review.
- Manually extracted meter logs now flow into the same system instead of sitting apart.
- The team sees the full picture: grid, weather, equipment, and market, in one place.
Let's Get You One Screen for Everything
Industrial operations generate data faster than most teams can watch it. Ariel turns scattered meters, sensors, and vendor feeds into one live system your team can act on. Bring us your operation, and we’ll show you what that looks like. Book a Consultation →